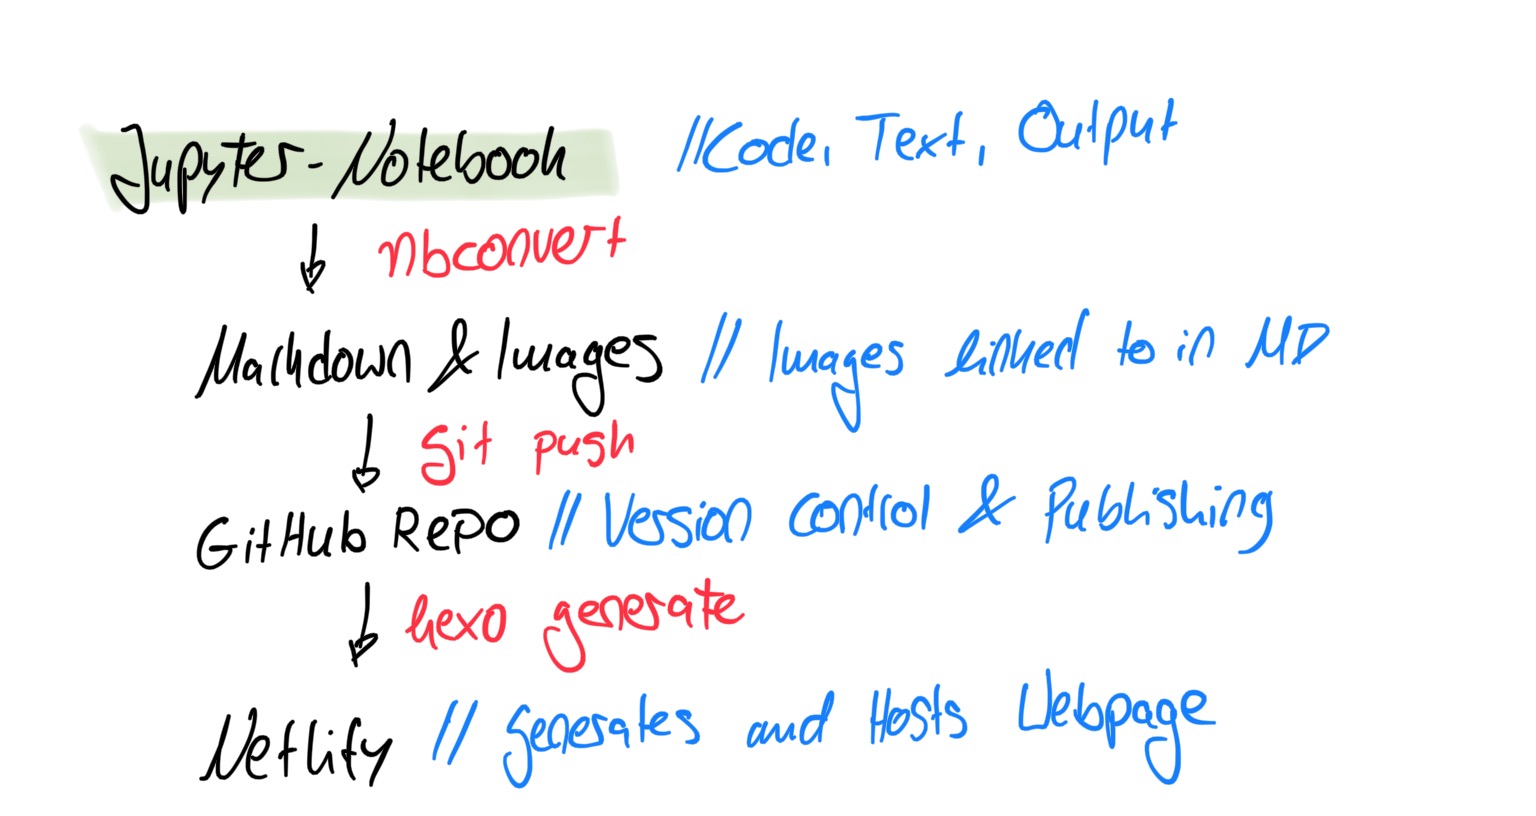
Today, we take a look behind the scenes! How does my writing land on the web? We take a technical perspective where I give you an overview of the coding pipeline and a more creative perspective, where I explain the “workflow” behind a DS-Econ post!
Today, we walk thru a basic machine learning pipeline including a train/test split and make use of a random search to conduct a hyperparameter tuning. This architecture is the backbone of many statistical machine learning tasks and hence usefuls as to keep close-by as a code-snippet!
Here, I will show you my current workflow to writing research papers in my studies. This is an approach to come up with a coherent and simple setup, which weaves together the literature and data related aspects of a project. In more detail, this approach tries to inter-connect the initial literature review and note taking (Notion), the easy creation of the paper’s references (Zotero) and all the necessary data analysis (R). Of course, we need to combine these resources to communicate our research results. Hence, these three threads are then combined with the help of R Markdown and bookdown into a research paper and presentation slides.
Do you need to create pivot tables in Excel, but prefer to work with Python? This is exactly what we are dealing with tody! In this post, we read in a csv file on a zoo’s food expenses and create a pivot table out of it - all in Python!