Implement Ploty into your Blog Posts
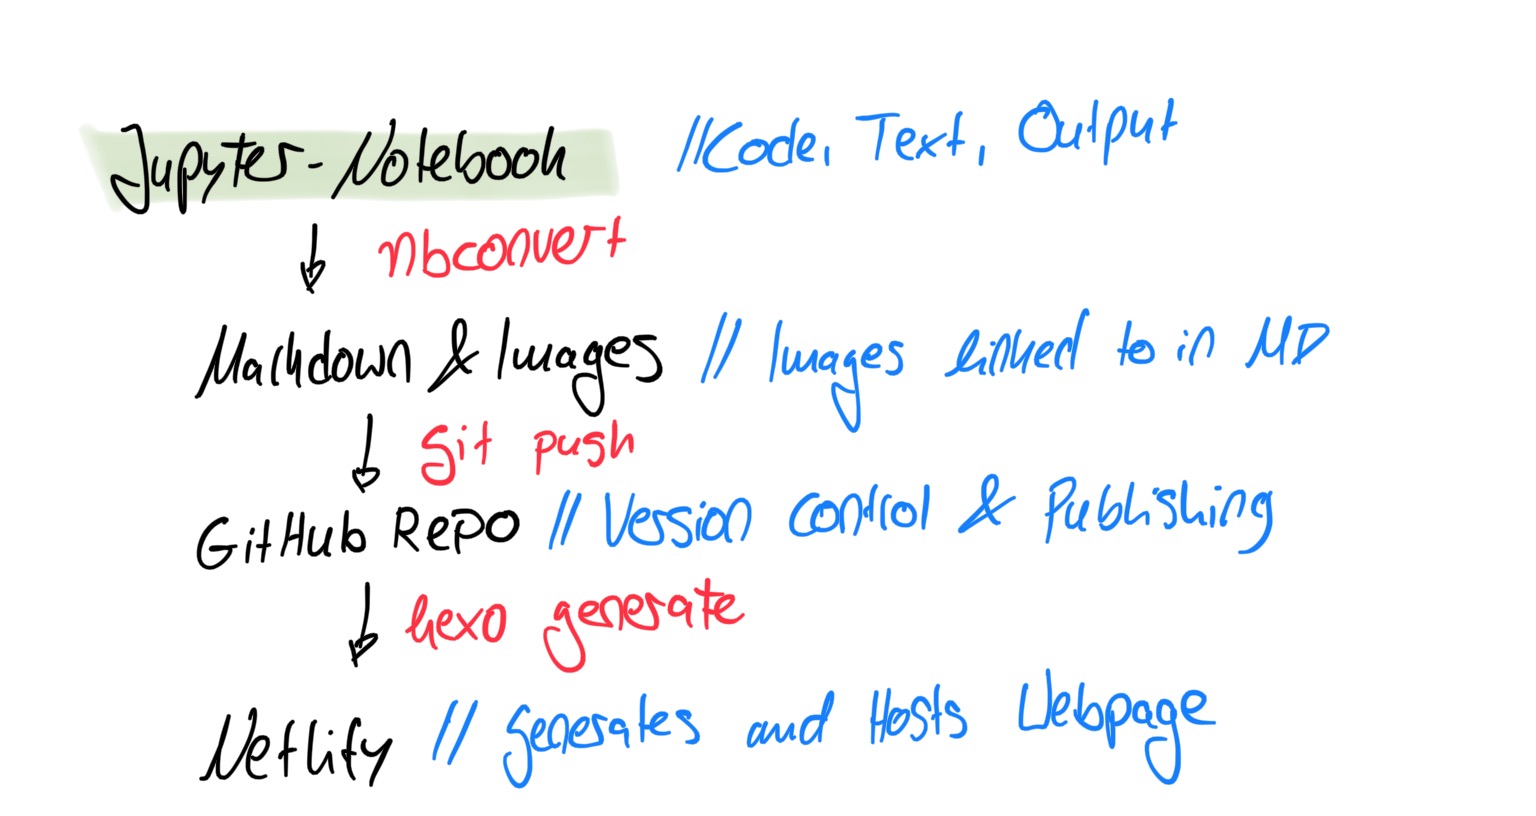
In this short post, we are looking at how to implement plotly graphs into your own blog posts. For this, I am assuming that you use a site-generating framework that is based on either markdown or html files. For DS-Econ I am using Hexo.
As a first step, we need to create our plotly graph. Here, we use a very simple example based on the gapminder data and visualize the life-expectancy and GDP per capita of different countries in a scatterplot.
We specify the color and size of our points to resemble the continent and the population of a country, respectively. This is a very frequent example for a more “complex” graph and you might have seen it before, for example here or here.
To use this graph in our HTML page later on, we need to save it as a html-file by using the plotly method fig.write_html.
1 | import plotly.graph_objects as go |
Great! Now that we have implemented the plot and saved it to a html, we can actually load it again as an html object and implement it into our notebook. For this, we use HTML inside display both from the IPython.display module.
1 | from IPython.display import HTML, display |
Finally, we can make use of the nbconvert module to convert our notebook to e.g. a markdown file. I implemented this as the CLI command in the cell below.
For my purposes, I also added additional options that exclude cells that allow me to exclude cells in the final output, based on a cell tag. Read more about cell tags here and the nbconvert module and its capabilities here.
Note for Hexo users: The hexo-renderer-pandoc package seems to cause trouble when it comes to rendering those plotly graphs. Uninstalling it with npm uninstall hexo-renderer-pandoc, fixed the problem for me.
Implement Ploty into your Blog Posts