In this code snippet, we look at how to edit axis and legend labels in seaborn. While this is a very basic task, it is one I find myself often searching the internet for. To give you (and me) a shortcut to a code example, I created this little post.
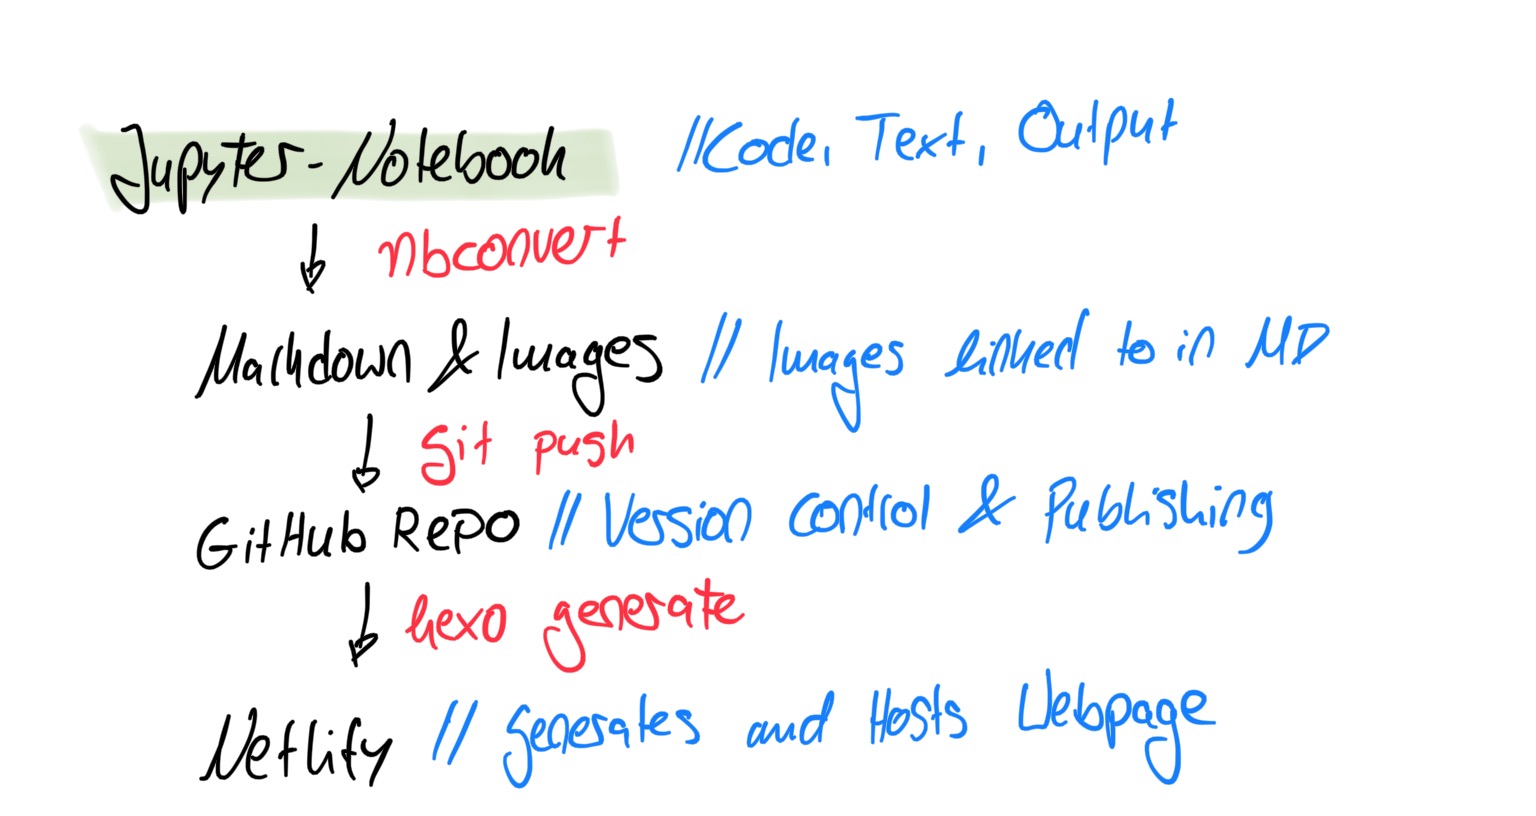
In this short post, we are looking at how to implement plotly graphs into your own blog posts. For this, I am assuming that you use a site-generating framework that is based on either markdown or html files. For DS-Econ I am using Hexo.
I wrote a little Code Snippet that returns the “California Housing” dataset provided by sklearn as a named pandas dataframe. Ready for you to use in your applications.
1
2
3
4
5
6
7
8
9
10
11
import numpy as np import pandas as pd from sklearn.datasets import fetch_california_housing
data = np.concatenate([dict_data.data, dict_data.target.reshape(-1,1)], axis=1) df = pd.DataFrame(data=data, columns=list_names)
I need some Data - Now!
Often times, we come up with an idea for a visualization or simply want to try out a new model we have heard off. In short: We need data.
However, this can sometimes become a tedious problem as a real world dataset might need additional cleaning, which can be too much effort for a short test or playing around. Here, a toy dataset can come in handy. There are tons of toy-data sets out there, many good ones presented by the sklearn.dataset module. In the example above I remodel the arrays provided by fetch_california into a pd.DataFrame.
This post is part of the Code Snippet Repository, a collection of short posts designed to make your everyday coding easier. These are based on public content from forums like stackoverflow and package documentations. You can find the code also in this repo on github!
Posted Updated Finn Python13 minutes read (About 1935 words)
In classification problems, we often want to assess the quality of our model beyond a simple metric like the models accuracy, especially if we have many different classes or they are of different importance to us. In this short article, I show you a more intuitive way to present the quality of your classification model - a color coded Confusion Matrix.