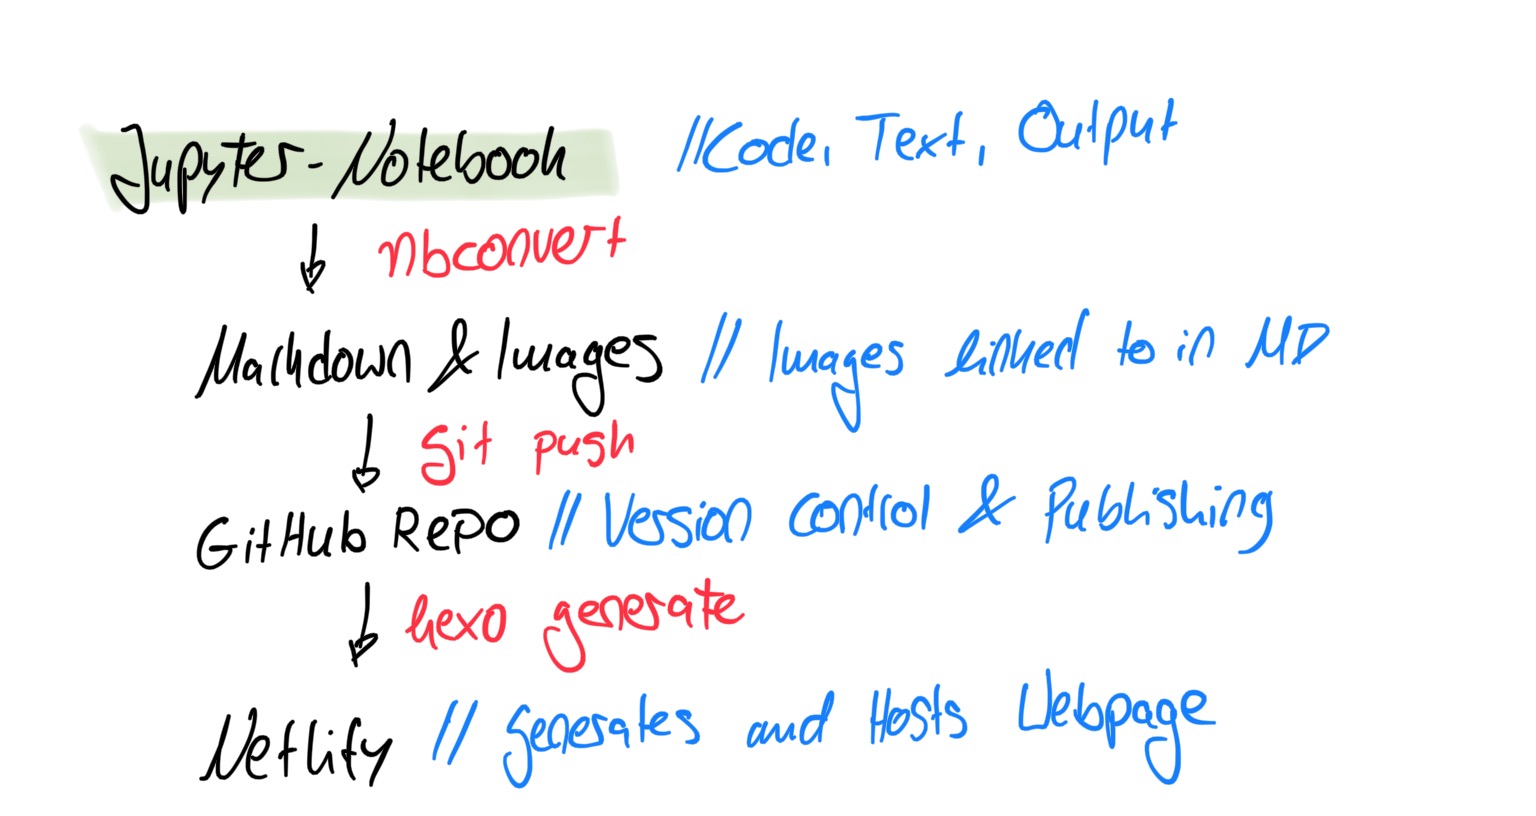
Today, we take a look behind the scenes! How does my writing land on the web? We take a technical perspective where I give you an overview of the coding pipeline and a more creative perspective, where I explain the “workflow” behind a DS-Econ post!
Here, I will show you my current workflow to writing research papers in my studies. This is an approach to come up with a coherent and simple setup, which weaves together the literature and data related aspects of a project. In more detail, this approach tries to inter-connect the initial literature review and note taking (Notion), the easy creation of the paper’s references (Zotero) and all the necessary data analysis (R). Of course, we need to combine these resources to communicate our research results. Hence, these three threads are then combined with the help of R Markdown and bookdown into a research paper and presentation slides.
In this code snippet, we look at how to edit axis and legend labels in seaborn. While this is a very basic task, it is one I find myself often searching the internet for. To give you (and me) a shortcut to a code example, I created this little post.
In this short post, we are looking at how to implement plotly graphs into your own blog posts. For this, I am assuming that you use a site-generating framework that is based on either markdown or html files. For DS-Econ I am using Hexo.